Tuesday, October 29, 2024

Economic data- Nevada


(Image 1)

The information in Image 1 is incomes per capita. Some of the poorer areas can be seen such as Pershing County (Northwest), White Pine County (Mideastern), and Mineral County (Southwestern). These counties all have around 20-30K in income per capita. This map is not the best for searching out informational bout the more affluent districts or counties, because the focus of the map is on lower incomes per capita  


(Image 2)

In Image 2, we can see where wealthy individuals tend to concentrate. Some of these counties are Douglas County (South of Carson City), Washoe County (North of Carson City), and Lander County (Central Nevada). These counties have about a 10-12% of their area that has a cumulative $200,000+ in income per household. We can assume from this that more upper class and wealthy people live in this area. This will be valuable information to refer to when it comes time to do the political analysis of Nevada. There is often a correlation between income/wealth and the political party that the household in general sways towards.


(Image 3)

Lastly in Image 3, it shows information on household that have less than $10,000 per household. We can see a lot of the information given to us in Image 1 backed up. We have some of the same counties being shown, such as: Pershing County (Northwest), Mineral County (Southwest), and Esmeralda County (Middle/central/T-shape). Some of the ones that are being represented here and not in Image 1 are Clark County, home to Las Vegas. With the information gathered from all the images we can see that while Clark County has a substantial low-income household population, there are also a hefty sum of upper-class households as well. This makes Clark County one of the most economically diverse counties in Nevada. This makes sense since Clark County also has one of the highest population densities in Nevada.


Monday, October 28, 2024

Wisconsin Economics Map -- Madison J.

Based on the demographic population maps that I used in the first blog post, I wanted to focus on examining income and how money affects other parts of life for the economics side of Wisconsin’s data. 

I separated the data into four separate categories: Income, MPD Business Patterns, and Education. All of these things are big talking points in political campaigns and influence voting.


A quick Google search will say that the average household income in WI is $74k per year. Looking at a 5-year estimate map of the Median Household Income, we can see that households that make the most amount of money are closer to the edges of the state and closer to the cities within WI and in neighboring states, Minnesota and Illinois. This is not unique to just Wisconsin, but important to note because of what/who exists in the neighboring land. Towards the end of the blog, I have included a map which roughly estimates where each Native American tribe in WI is located. If we compare that map to the income data, we can see that people who live in these counties tend to earn less income. 


Another quick Google search will say that WI’s primary business exports are in manufacturing machinery, which brought in around 6 billion dollars in 2023. When I set the map to MPD Business Patterns focusing in on the total employees in manufacturing jobs per county.  

Price County had the most at 44.7%, followed by Waupaca County at 44.5%, and Trempealeau County at 42.8%. Comparing income to MPD Business patterns, some of the lower-income counties, like Price County, are working more blue-collar jobs.


Wisconsin is home to 85 colleges and universities. Over 160,000 students are enrolled in the University of Wisconsin system alone. Before starting a Social Explorer map for education data, I noticed in my demographic population map that WI has a notable Native American population and a few federally recognized Indian reservations. I also noticed that the College map and the Native population map are almost visually inverted with the reservations towards the Northern parts of the state and the colleges towards the Southern parts. Using Social Explorer, I set a map to the ACS five-year estimate of the Population 25 years or older with a Bachelor's Degree or better. This map mimics the household income data, not surprising, but still notable. It’s also worth noting that the counties with more blue-collar workers have less data for college-level education.


https://dpi.wi.gov/amind/tribalnationswi


https://mycollegeselection.com/maps/colleges-in-wisconsin-map/

Sunday, October 27, 2024

Ohio Economic Maps Post

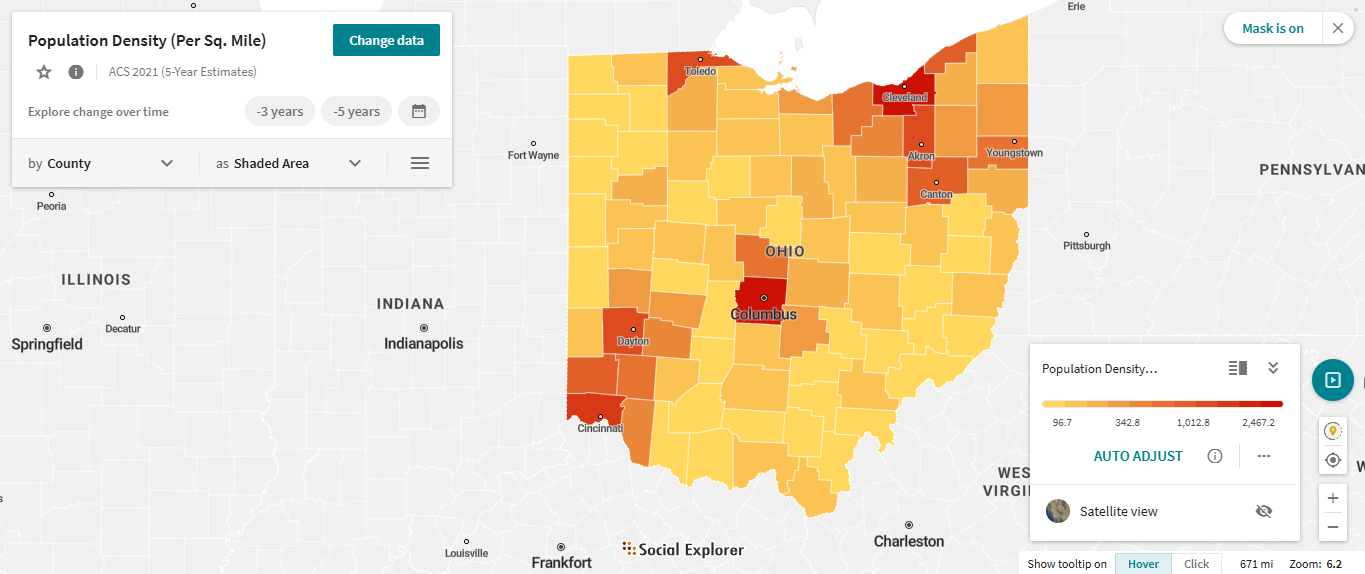
The maps I selected are median household income, population density, and median housing value.

Ohio seemed to have some strange distribution as far as highest median household income goes.  Going in, I had expected to see a bias toward the larger cities, but got a somewhat stranger result.  Rather than being the counties of the major cities, the areas of the highest household income were all directly next to a major city, but distinctly excluded the major cities themselves.  I checked a few different possible things to see if there were any correlations, such as race, bachelors or higher education, labor force size, and unemployment rates, with little to no results.  The only thing I came across was median housing value correlating, though I would assume this would be a result of the stronger industry in these areas, and not the other way around.  This would need further research to analyze to any meaningful degree.


Notice how the darkest counties on the lower map of population density seem to be rather low on the income map on top, but are surrounded by 1-2 significantly higher income counties.

In my search, was the only map that seemed to have a meaningful correlation with the income map.  However, if there is meaning behind this correlation, I would guess that the income explains the housing cost, and not the other way around.


Friday, October 25, 2024

Ben Nickels- Post on Florida Economic Data

BEBR at UF on X: "While Florida's per capita personal income in 2019 was  $52, 426, over half of Florida's counties had a per capita personal income  between $22,440 and $44,180. https://t.co/0FgIRhjqMM" / X

https://x.com/BEBR_UF/status/1377985575836389381


https://storymaps.arcgis.com/stories/53a0d22326c04622969756ecfb8cf474


https://edr.state.fl.us/content/presentations/economic/FlEconomicOverview_1-22-24.pdf


    Florida is no longer a swing state as of 2022. That year Ron DeSantis absolutely crushed Crist in the gubernatorial election winning nearly 60% of the popular vote. In 2020 Trump won Florida by a little over 3 points and now he is expected to double his lead according to the polls. Oftentimes when attempting to understand why people vote the way they do it can be helpful to examine the economic status of the state one wants to focus on. As per the assignment I've chosen three maps in order to better understand the economic status of Florida in order to learn more about the state and hopefully gain some insight as to why Florida has become a likely red state. When analyzing the economic data I noticed that the Broward County, Miami-Dade County, Pinellas County, Hillsborough County, Orange County, and Palm beach county seemed to be the most economically significant counties in the state having some of the largest GDP's in Florida as well as having low levels of unemployment and in some cases high per capita income levels. When we dig into the voting patterns of these counties with the economic data in mind we see something interesting: there has been a strong shift to the right in these counties. there also seems to be a number of counties with low per capita incomes such as Glades, and Holmes county who voted strongly for DeSantis in 2022. There could be numerous reasons for all of this happening but I find it interesting is the short time in which this shift has happened. Counties such as Miami-Dade went red in 2022  despite going Blue in 2020. Many factors contribute to this shift, according to a USA Today article on the topic "(it's been caused by)... more Republicans moving to the state than Democrats, a huge GOP voter registration advantage, national political realignment shifting more non-college educated voters toward Republican candidates, a growing Hispanic population that is trending more conservative, a weak Florida Democratic Party and major GOP figures who have put their imprint on the state. " No doubt economic factors are contributing as well the same USA Today article provided an anecdote about a man named Reyna and his family "... Reyna’s wife had offers to work in Florida as a nurse. The pull of family, jobs and COVID politics led the Reynas to make the move in November 2020. 'They really took the lockdown super seriously (in Massachusetts) and they shut everything down,' said Reyna, who now lives in the Miami area. 'I didn’t see that kind of closure in Florida. From a professional standpoint, that was appealing.'" As we can see the response to COVID in Florida may also appeal to some voters who moved from other states as well as various other factors. Overall Florida's shift from swing state to likely Republican is a fascinating one with various factors contributing to this. When one analyzes the economic data in these maps along with voting patterns it will help provide some insight as to why this shift may be occurring.


https://www.usatoday.com/story/news/politics/elections/2024/10/07/florida-no-longer-swing-maga-stronghold/75465191007/


Thursday, October 24, 2024

The Beholding Eye: Five Views of the Same Scene

    City Park in Reading, Pennsylvania, is a rich tapestry of natural beauty and community space, interpreted through various persons via their own unique cultural, social, and personal lenses. Every perspective that emerges reveals unique features of the park and captures the rich variation of meaning and value encoded into the landscape.

    It is in this sense a peaceful retreat for the retiree from hustle and bustle. The park is his retreat wherein the retiree feels he can relax and reflect upon his life. The greenery, gentle rustling sounds of nature, the pathways-all evoke a sense of nostalgia and give quiet surroundings to retreat to. He will find quiet corners in the park where one can muse over life and enjoy the easygoing pace of life. The historic aspects of the park, along with the calm atmospheres, give a sense of continuity and solace, enabling the retiree to relate to the memories and the beauty of nature.

    In sharp contrast, to an imaginative child, City Park is one big playground in which everything is possible to venture into. To this child, the park is a place full of action and discovery. Open fields become places of fantasies, while playground equipment and natural elements become parts of some great tales and games. The features here in the park spur curiosity and creativity; after all, each tree, every pathway, and every swing offers a new opportunity. For the child, the park is a place of endless fun and discovery.

    The perspective of a city planner on City Park is based on criteria concerning urban design and community development. A planner considers the layout, infrastructure, and placing of the park within an urban setting. They consider how well the park functions to provide a green oasis among city building and construction, including impact on the quality of life for the residents and environmental sustainability. To the planner, this is a very successful model in balancing the requirements between city growth and places where citizens can enjoy their recreational times. Facilities within the park and how it is maintained simply point to a design that is well thought out, adding toward general well-being.

    An environmental activist's view of City Park focuses on conservation and ecological impact. They see it as a microcosm of broader environmental issues, identifying both positive and negative features of human influence. The state of the park-litter, erosion, changed vegetation-reflects and echoes other environmental problems. For the activist, the park symbolizes the struggle to preserve natural spaces in urban environments. They most likely would encourage more sustainability initiatives and civic engagement for the above-mentioned environmental concerns and wise management of natural resources.

    To the tourist, City Park provides a glimpse of the culture and tradition that is Reading. The beautifully maintained grounds, the historical aspect, and the scenic beauty are part of what this city is and its persona. The park is a snapshot of the aesthetic and cultural identity of the city, indicating the commitment of the city to public space preservation and enhancement. To the tourist, it is not only a beautiful place but also a cultural landmark that adds to the knowledge and enjoyment of the town.

    Conclusion: City Park in Reading presents a complex landscape interpreted through several lenses. Each perspective-from retiree seeking peace, from child in search of adventure, from city planner focused on design, from environmental activist concerned with conservation, and from tourist appreciative of local culture-unveils a different layering of meaning and value. Such a diversity of perspectives will stress the dynamic relationship between people and place and demonstrate how cultural landscapes are sculpted through unique experiences and priorities of people interacting with them.

City Park offers many beautiful and quiet places to reflect.


Friday, October 18, 2024

Cultural landscape essay

 Chruch of Orsanmichele: The Chameleon Church

The Renaissance brought about change, warping the people’s perspective on art, religion, and core values. Change is evident in the city of Florence as it is one of the major landmark cities when it comes to the Italian Renaissance. Change is brought about by economic, political, environmental, and social factors. All of this can be seen in The Church of Orsanmichele. The Church of Orsanmichele is an example of a repurposed landscape. This church is a prestigious place of worship in the heart of Florence. It is down the street from Santa Maria del Fiore Cathedral, Florence Baptistry, and the Medici Palace. The Church of Orsanmichele is predicted to be constructed in the 700s as a private chapel for worship. It was later demolished in the late 1230s, because of a family feud. The building was torn down due to social interaction; that being the disagreement. In 1285, The building was reconstructed but rather than be a church, it was made into a loggia to store grain. This change was brought about because of economic opportunity, stemming from growth in population size. One of the columns of the loggia had a painting of the Virgin Mary. This column became a hot spot for worship as it was said to heal people blighted by the plague. In the early 1300s, a fire broke out which destroyed the building once more, and reconstruction was set for 3 years later. This shows how this building was affected by the environment. During construction, there were multiple times when the building threatened to collapse. By the end of construction, there were multiple statues commissioned of patron saints by the major and minor guilds. This shows how as the Church became more popular, the amount of money invested in the church also increased.

Major and minor guilds can be easily differentiated because of the wealth disparity. Minor guilds were only able to commission their statues made from marble, while the major guilds could glorify and commemorate their patron saints by commissioning a piece made of bronze. Some of the prominent statues commissioned were Donatello’s Saint Mark made of marble. This piece was commissioned by the minor guild, Linen Drapers and Peddler's Guild. Another influential piece is Saint John the Baptist by Ghiberti made of bronze on the behalf of the major guild, the Merchants Guild.

The Church of Orsanmichele’s past is filled with change and modification. It is affected by the social, economic, political, or environmental climate at the time, including the time in its early history when it was perceived as an eyesore by the public. When the building failed to serve a meaningful purpose, it was changed. When the public wanted to have a separate place to worship Madonna, the building added two upper stories to accommodate for the bottom floor being a dedicated church. This was so the building could continue to serve a religious and economic purpose. The increase in storage space can also be linked to the economic needs of the time. The extra grain storage aided in the growing grain market, brought about by population growth. Because there were more mouths to feed, more grain was sold therefore requiring more grain storage. The time in which the population was growing lines up with around the time before the Bubonic Plague, which eviscerated the Florentine (and overall European) population. Before the Black Plague, Florence's population was doubled. This was a time where most of the emphasis was on the grain market. Food was more important and immediately relevant because if more people were in a family, more food was needed in that household.

Fast forward to the mid 1300s, when the church was ornamented with patron saints. It was converted into a place that emphasized worship. This shows a priority of religion. It was a place for the guilds to show off their wealth and prestige. It makes sense that there is more of an increased interest in religion at the time as the Bubonic plague only lasted from 1346-1353. In the context that people believed that the Madonna painting was able to heal the sick and infected persons, it is not hard to see why more people began to flock to the Church. The Black Plague was a time of intense fear, so people might look to divine intervention to help them as a last resort.

During the time of the Black Plague, there was also economic strain. Trade plummeted and borders between countries were closed. This made people isolated in their towns, and many people lost their jobs. This is a time of economic recession. Thankfully after recessions hit their trough, they enter a time of expansion. This means people would have more jobs equating to more money to spend. There would be growth in the number of people in guilds, leading to more guild prestige, funds, and reliance. Some guilds would become more influential and wealthier than others, which is why only some major guilds were able to commission bronze statues. This lines up with a movement going on at the time, where guilds, merchants, and bankers were some of the most politically and socially motivating people.


Ethnic Landscapes Essay

                                                 The Importance of Ethnic Landscapes.


An ethnic landscape is often there to represent a specific ethnic group. It is also known as landscapes that an ethnic group refers to as “belonging to them.” Ethnic landscapes can also have an aspect of history in them, and shows how humans interacted with the natural environment, and it also shows how people prioritize these lands, and do their best to care for them. The reason why ethnic landscapes are so important is that they represent culture, which is something a lot of people hold close to them since an ethnic landscape is a visible place of human activity on the landscape. It also shows aspects of evolution. 

An example of an ethnic landscape is the Christ the Redeemer statue located in Mount Corcovado, Rio de Janeiro, Brazil. The statue was completed in 1931, and stood 98 feet tall, and the arm stretched out to 92 feet. This is an example of an ethnic landscape since it represents the salvation of Jesus Christ accomplished, which is important to the people who identify themselves as Catholic and Christian. It is seen as a “symbolic protector of the people.” Christ the Redeemer is also known as a cultural, and ethnic symbol since it expresses the “feeling and blessing of the Brazilian people.” It is a symbol of Christianity around the world, and was so popular, and loved by the people that it was voted to become one of the 7 New Wonders of the World. 

Another example of an ethnic landscape is the Taj Mahal located in Agra, India. This famous landscape is known as the “symbol of love.” A reason why this landscape is so loved by the people is because inside the Taj Mahal is a marble chamber filled with many different designs, and patterns. Also, it is known as “the jewel of Muslim art in India and one of the universally admired masterpieces of the world’s heritage.” Just like Christ the Redeemer, it was so loved that it was selected to be one of the 7 New Wonders of the World. The Taj Mahal is also an example of different styles of Mughal architecture. This famous landscape is a symbol for ethnicity, and is cared for by the people of India. 

A final example of an ethnic landscape is the Great Wall of China. The purpose of this ethnic historical landscape was to protect the country, and to stop tribes from the north from invading China. This famous wall is loved by the people of China because it provides a sense of security, and safety. It is also known for its inspiration since it’s a symbol of Chinese literature, and art, and has inspired many other artists. The Great Wall of China is also a representation of the national pride of the people. It’s a symbol of the country’s strength, history, and unity. Just like Christ the Redeemer, and the Taj Mahal, The Great Wall of China was selected to become one of the new 7 Wonders of the World. 

Overall, an ethnic landscape is a representation of a specific ethnic group. It’s something that reflects over a certain group of people, and is a landscape they hold close to them. These landscapes also reflect on the ethnic group’s history, and represent how these ethnic groups interacted with their land to show their culture. An ethnic landscape is a visual aspect of a person’s culture, and that is why they’re so deeply cared for in their nation. 

Great Wall of China Image Credit: https://www.nationalgeographic.org/society/

Taj Mahal Image Credit: https://www.history.com/


Placeless Landscape

     A placeless landscape I see often is Airport Road Shopping Center. This shopping center consists of stores like Target, Starbucks, Ulta, GameStop, Fine Wines & Good Spirits, etc. Stores you can find almost anywhere and have been there for a long time.    

The Airport Road Shopping Center is a landscape that I can identify as “placeless,” because of the big stores that are at every shopping center, like Target, or GameStop. Yet I also can identify Airport Road because of its personal significance to me. Airport Road has always been a place I would either shop or pass every day because of its location. It was the closest shopping center to me for most of my life, and it also was on the way to my elementary through high school. Since I was always there or passing there, I could identify it based on how it physically looked, or the layout of the stores. Yet if you’d name all the stores there and then asked me what shopping center you're talking about, I wouldn’t know. This is what makes the Airport Road Shopping Center inevitably “placeless.”  

For example, there are tons of shopping centers that have the same stores. A shopping center like this is Crest Plaza. Crest Plaza shopping center has the stores Target, GameStop, Fine Wine & Good Spirits, etc. It has very similar stores to the other shopping center. The little stores that they differ from don’t provide that much of a difference to make these two shopping centers distinct in any way.  

Nowadays most shopping centers have these things, because it would be found inconvenient if they didn’t. If a shopping center didn’t have some sort of grocery store, or any popular stores that people like, then most people wouldn’t bother going. They wouldn’t have a reason to. The only reason I go to Crest Plaza now is because I live closer to it and it’s convenient to be able to get groceries or things I need there.  

Globalization like this has its pros and cons. There are good things about globalization like letting everyone experience similar stores like TARGET, as well as making different places feel more connected, because of the familiarity with similar stores. Yet globalization can be a bad thing because of the lack of diversity and distinctness between different shopping centers and stores in general. It limits reasons to go to other countries if they have the same cultures and same stores we have here. Also, if we have places so indistinguishable, they lose all their culture, all their significance.  

Yet placeless landscapes will continue to grow, as well as Targets and GameStops will continue to exist in many different shopping centers. It’s important to have these little placeless landscapes, but also definitely to keep enough culture and diversity to the stores we have around us. Maybe don’t always get the groceries at target, even though it’s convenient.