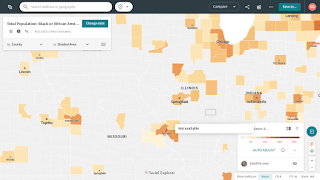
This second map represents the population of women in Illinois. This is an important factor for the upcoming election because they make up a high population of Illinois with the highest numbers of women living in or around Chicago. This is also important to the election because women are more likely to vote for Harris because of the many discussions being had about women's rights, bodily autonomy, and Roe v. Wade being overturned. Because of this, women are more likely to vote for Harris due to her stance on protecting these rights for women.
The last map shows how many households within the different counties of Illinois have an income of $100,000. This is important to the upcoming election because higher income voters are more likely to vote for Trump. This may be due to his ideas on tax cuts and building the economy. They may also choose to vote for him because they agree with his ideas on big business and promotion of investments for entrepreneurs.


2 comments:
I think it is interesting how you used race, gender and income to predict the political interest of people. I definitely do agree with you because people tend to support politicians who they can relate to and have ideologies that are similar to their’s.
The nuanced analysis you did of the demographic data of Illinois was particularly instructive as it related to the voter behavior in the upcoming election. Emphasizing the Black/African American population and the rights of women points to a key bloc of votes that could crucially affect the outcome of the election.
I feel that the Black president representation would surely resonate deep in the Black community, highlighting camaraderie and advocacy toward issues relevant to them. So, in similar light, attention toward women's rights, specifically in face of recent judicial change-ups, highlights just how crucial these demographics are in shaping up political landscapes.
On the over $100,000 households, it really rang a bell when you mentioned how such households tend to vote for Trump. It is so related to economic policies. Apparently, voting habits can be very prejudiced by financial interests, and therefore, economic variables must be considered hand in hand with demographic data.
It would then be interesting to observe how these trends pan out once the election draws nearer. Do you think other demographic factors, like age or education level, also play an important part in the turnout of voters and their decision-making?
Post a Comment