Monday, September 30, 2024
Population Distribution and General Demographic Data - Abbee Fries
This is a view of the ACS 5-year data of California's population distribution and general demographic data. This map is by county, showing general demographic data from 2022. The coastline as well as the large cities in the state are the most dense in population. The most populated cities in California are San Francisco, Sacramento, and Los Angeles. The rest of the state had significantly less population density, especially the areas farthest away from the coast. I think the main draw of California are the cities and the coast, explaining why the rest of California isn't as heavily populated.
Population Distribution and General Demographic Data- Evy Reynolds
The first map I inserted shows the general population of Georgia and what places have the most people. You can see that Atlanta is heavily shaded as the most populous part of Georgia, and the counties around Atlanta also have many people. Greenville County is one of the most populated counties. Population is important for an election because the areas in the state that have more people will sway the vote more than less populous areas.
The second map shows what counties have a higher percentage of black or African American residents. Again, Atlanta and the surrounding counties show up as a big factor. Henry County and Brian County have some of the highest percentages of African American or Black people. This is important for the election because people of color and marginalized groups tend to vote for Democratic candidates. Therefore, seeing the amount of Black or African American residents in a state can help predict what kind of results the election will have in that state.
My third map displays the places in Georgia with high amounts of people under 35. We can see that there are a good deal of young people in Georgia but they tend to be populated around the cities. Part of the reason for this is simply because there are more people in and around cities. I couldn't find a map that showed this age group as a percentage instead of an amount. However, age is also an important factor in elections, as older people tend to vote Republican, while younger people tend to be Democrats.
Population Distribution of New Jersey - Emily Martinez
Population distribution and demographic data: Wisconsin
Through Social Explorer, I created a map examining Wisconsin's population density per square mile using 5-year ACS data. I chose this state specifically because of its value as a swing state during election seasons.
NOTE: I used the pen tool on my computer to add some notes and marks drawing attention to the most important parts of these maps.
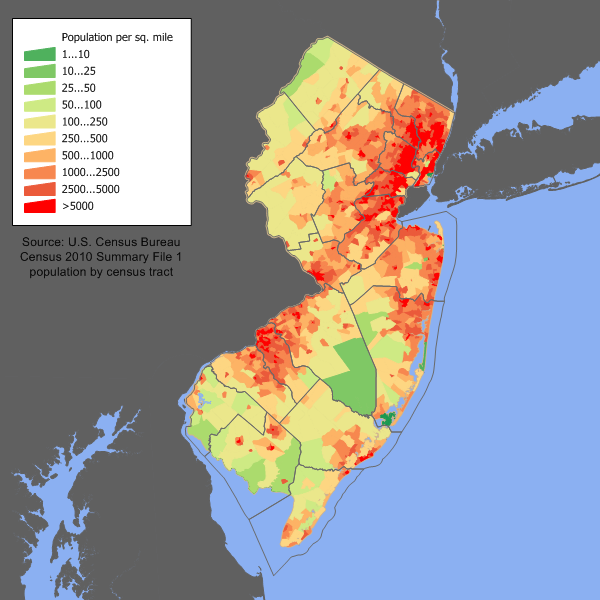
I think it's important to remember that land doesn't vote, people do.
The first map is just the general overview of the state, which I have outlined in purple so that we can see how much landmass we're working with. Right away, the eastern coast of the state jumps into focus-- specifically cities like Milwaukee, Appleton, Madison, Green Bay, and Kenosha. The city with the highest population density is Milwaukee with a pop. density/sq. mile of 3,864.3. In a drastic difference, Forest County only has a pop. density/sq. mile of 9.1.
Notice how the areas closest to the neighboring city, Chicago, tend to be darker-- becoming lighter as we move further away. Surprisingly, the northern counties near Lake Superior do not have the same demographic population as the counties near Lake Michigan. Usually, people are drawn to large bodies of water, but in this case, the highly populated cities have more of a pull on the state as a whole.
Just out of curiosity, I found a map documenting where the college campuses in Wisconsin were located. To no surprise, the population density matched up with the map of student locations. ( https://mycollegeselection.com/maps/colleges-in-wisconsin-map/ ).
Looking at the names of the cities and counties in Wisconsin (ex. Kewaunee, Waupaca, Chippewa, etc), I wanted to see if the state had a strong Indigenous population. I made a new map to look specifically at 5-year ACS data for "Total Population: American Indian and Alaskan Native Alone." By the looks of it, while the Indigenous populations seem to become darker towards the northern parts of the state, the only densely populated county for this demographic is Menominee County.
Map 1: Population per Square Mile map of Florida taken from Wikipedia. Source is listed on screen
Map 2: 2020 US Presidential Election in Florida by Precinct source: https://mcimaps.com/how-floridas-congressional-districts-voted-in-the-2020-presidential-election/
Map 3: Average weekly wages in Florida by county Source: US Bureau of Labor Statistics.
Analysis: Florida has been a swing state since 1952 before then it had voted almost exclusively for democrats. In modern times it's flip flopped during numerous presidential elections such as voting for Obama in 2008 and 2012 to voting for Trump in 2016 and 2020. There are numerous factors for this including Ron DeSantis's governorship, the diversity of the state of Florida and the presidencies of Biden, and Trump. However I'm not going to get into that in this post. I am simply going to analyze the state of Florida politically using exclusively these three maps and my own experiences and knowledge. Most areas that vote democratic are large cities including Orlando, Miami, and the Tampa Bay Area. I've had the pleasure or displeasure (depending on how you look at it) of visiting Orlando on two occasions and Jacksonville once and I can safely say the city of Orlando is growing at an incredible rate. The hotel I stayed at during my first visit was torn down in favor of a larger one. Traffic was terrible, and there were loads of apartments, new homes, and new vacation resorts lining the streets of the city. I also know that Tampa Bay is also a fast growing city. All of this I think will play a roll in the next election how will it? Only God can truly say. One thing I found unsurprising regarding Florida was the rural/urban divide which echoes the rest of the country with an exception: Panama City. I also found it unsurprising that the areas that by and large the counties that made more money tended to vote Democrat while the counties that made less money voted Republican. Overall I found these maps a good introduction to the politics of Florida and of the overall demography of the state.
Blog Post #2 - Demographics of Pennsylvania - Hunsicker
Bibliography
Marlon, Jennifer, Emily Goddard, Peter Howe, Matto Mildenberger, Martial Jefferson, Eric Fine, and Anthony Leiserowitz. 2023. “Yale Climate Opinion Maps 2023.” Yale Program on Climate Change Communication. December 13, 2023. https://climatecommunication.yale.edu/visualizations-data/ycom-us/.
Sunday, September 29, 2024
Population Density- Nevada
When looking at the population density of Nevada, there are 2 clearly observed densely populated areas. These are the counties: Clark County, which is to the south and the western area of Carson City. Carson City’s population density bleads north and east. Clark county has a population density of 293.7, while Carson City has a population density of 405.8. One significant difference geographically between Carson City and Clark County is the fact that Carson City is 168 square miles while Clark County is 8,092 square miles. The reason Carson City is so densely populated is because it is the capital of Nevada. The capital has an increased importance along with a substantial number of inhabitants in comparison to its small square milage. On the other hand, Clark County includes Las Vegas, an extremely popular attraction / destination, which pulls in over 40 million tourists a year. Carson City has about 59,000 inhabitants, while Clark County has over 2.3 million inhabitants. This means that there are about 351people, in Carson City, for every square mile. Clark county has a ratio of about 284 people per square mile. Overall, I believe that Nevada will swing blue this year. With the past 4 election cycles, Nevada has been democratic leaning. I believe that the more densely populated areas of Carson City and Clark County will vote democratic. This is a popular thing for densely populated areas. They tend to be more liberal in nature as they also tend to be more diverse.
(below is an image of Nevada's population density shown by county)
Population Distribution and General Demographic Data- Brooke Steed
Tuesday, September 24, 2024
Liv Phelan and Brie Humbles - New York: Population Distribution and General Demographic Data
In this map, we examined the five year ACS data for the state of New York on a county-by-county level. We observed the absolute count data, using the Natural Breaks (Jenks) classification method for our cut points. Upon observing just the state of New York, we could see a clear imbalance in the breaks due to the high density of New York City and the surrounding boroughs compared to the rest of the cities in the state. The counties surrounding the city having such a high density leads to socioeconomic factors that influence political alignment among residents. For example, the high population density leads to statistically higher living costs alongside poorer conditions, which is historically linked to the interest of the democratic party. This party benefits urban-dwelling citizens because they tend to advocate more for the needs of diverse populations, which tend to be found more commonly in cities. The high density can also lead to shared views among citizens in close proximity. Moving upstate, we see a much lower density due to more land availability. As we draw nearer to major cities (Syracuse, Albany, Rochester, and Buffalo), we find the density of the population increases, but not as exponentially as in the major boroughs of New York State. Due to lower cost of living and better economic conditions, these citizens are historically more inclined to vote for Republican candidates. The Republican Party tends to advocate for the objectives of upper class citizens.